
When assessing the effectiveness of price regulation, the metrics used are the dynamics of regulated prices in real terms, as well as the capital productivity of enterprises, the efficiency of energy use in heat production and in electricity and district heating networks, and the quality of the service sold to consumers (the indicator is the quality of energy supply, which is measured in the security of supply indicators of electricity network services: SAIFI, SAIDI, CAIDI).
The Competition Authority analysed the ‘behaviour’ of the various metrics mentioned above (on the period 2021–2023)1, which are characterised in price regulation by changes in the energy sector. An energy price shock occurred in the last months of 2021, which continued to be acute and extreme in 2022, and a certain stabilisation trend only started in 2023. This period, especially 2022, saw very high volatility in electricity prices, a doubling of CO2 prices, as well as an extreme price increase in the natural gas market (see dynamics in Figure 1), along with problems in ensuring security of supply for various fuels. The volatility in the inputs described above also caused significant fluctuations in the prices of various services and the capital productivity of monopoly undertakings.
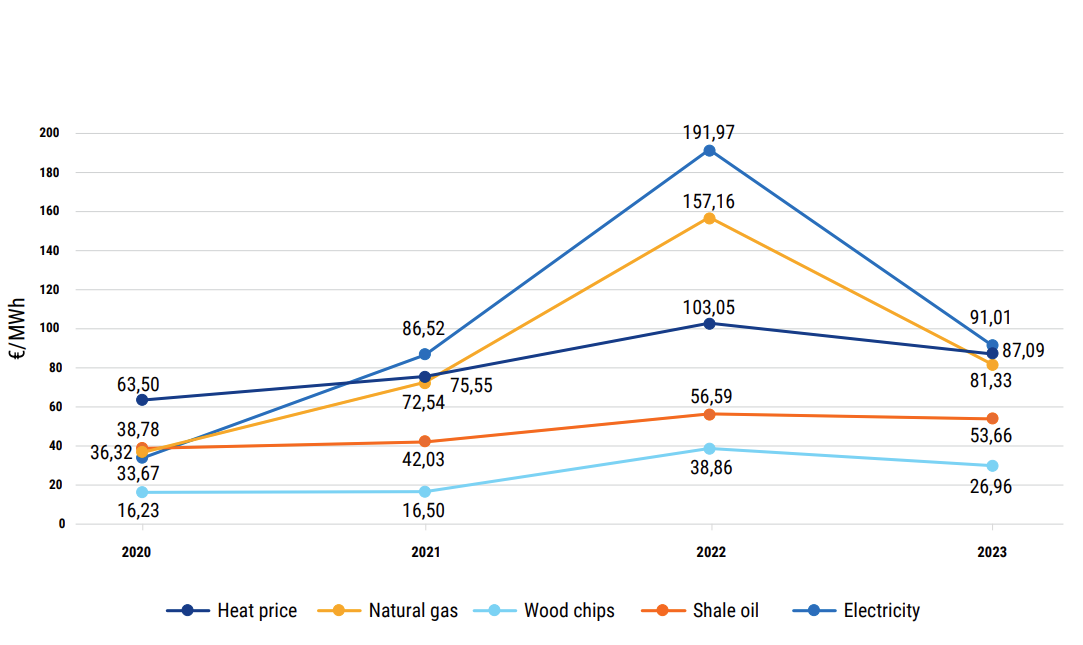
Figure 1. Average fuel and electricity prices in the marginal heat price
In the case of gas network services, a significant decline in gas consumption had an additional impact on operations and prices. In turn, changes in the prices of monopoly services, especially in the energy sector, have a significant impact on the general price changes in the economic environment (the consumer price index (CPI)). For example, a 5% price change in district heating in the capital city impacts the CPI by one tenth of a percentage point, and a change in the price of electricity network services has a similar effect.
Therefore, the proactive actions of the authority as an energy market regulator are especially important to ensure that the decrease in input prices for fuel and electricity reaches consumers of monopolistic services quickly enough. For example, when comparing heating costs – which make up a significant portion of consumers' total expenses – the authority estimates that proactive measures helped reduce heating costs for consumers in 175 district heating network areas by nearly 50 million euros in absolute terms.
In the long term, the analysis shows that the prices for water services and electricity network services in the companies reviewed have mostly remained below the base year level in real terms. However, gas network service prices have increased, primarily due to a decrease in gas consumption volumes.
An analysis of capital productivity indicated that the affected companies suffered the most during the energy crisis year due to extreme price fluctuations. Recovery continued in 2024.
In the area of energy saving, price regulation can be considered successful in the long term – both electricity losses and losses in district heating lines have been significantly reduced. The aim of the gradually decreasing technical requirements for district heating line losses set out in the Competition Authority’s methodological guidelines is to motivate heating undertakings to make investments in district heating lines to continuously reduce line losses. By 2023, the weighted average relative heat loss in the largest network areas has decreased by 1.5 times over the 23-year period considered in the analysis. The reduced heat loss means a larger amount in absolute value (375 GWh) than, for example, the amount of heat sold to the Narva network area in 2023 (363 GWh), and a financial saving of nearly 33 million2 euros.
For consumers, the reliability of Estonian electricity networks in recent years has been characterised primarily by the increased time for eliminating faults in the largest network operator’s network due to the increase in the frequency of more extreme weather conditions and responding to them. As a result of the supervisory proceedings in 2022 and 2023, the Authority has identified shortcomings in the maintenance of line corridors and the organisation of rapid elimination of power outages by Elektrilevi OÜ. The situation is illustrated by the increase in the network operator’s power outage duration (System Average Interruption Duration Index, SAIDI) per consumption point per year (in minutes), which in 2023 has increased significantly compared to previous years (to 454 minutes). Although more difficult weather conditions have also affected the security of supply indicators of other networks, fluctuations in the quality of those networks’ security of supply occur on a significantly smaller scale, partly due to differences in the networks, such as compactness, structure, etc. Since it is possible to increase the reliability of electricity distribution networks through large-scale investments, in addition to high-quality network and line maintenance and fault management, it is necessary to find an optimal balanced solution. Excessive emphasis on investments alone would lead to a significant increase in network charges, but the indicators characterising security of supply may not improve if there are shortcomings in network maintenance and response to failures.
References:
1 The Authority's latest review of regulatory results included data up to 2020; the dynamics of various metrics can be observed over a period of nearly 20 years or even longer (e.g. information on energy losses since 1999, capital productivity, quality and price dynamics since 2005 (in the case of water service and gas network service prices, the observed period is somewhat shorter).
2 Calculated based on the average heat cap price for 2023.